Yes. It is FREE!
And, yes, it is Open Source!
A tool to help you visualize the code you are debugging. Watch all those local variables -- global variables. Those Call Stack? Visualize all of them while you Step Through, Step In, and Step Out of each line on your code.
Last time I had this experience was back in college using the Universities copy of Visual Basic as I debug my VB school projects.
Thanks this Open Source tool, I can do it again on my Open Source C++ project. Yes, debugging a C++ code with a visual tool! How great is that?
So, which is this that lets you visually debug your C++ code? None other than Visual Studio Code. Yep. That open source Visual Studio from Microsoft.
Wait. Don't close this tab! Hear me out.
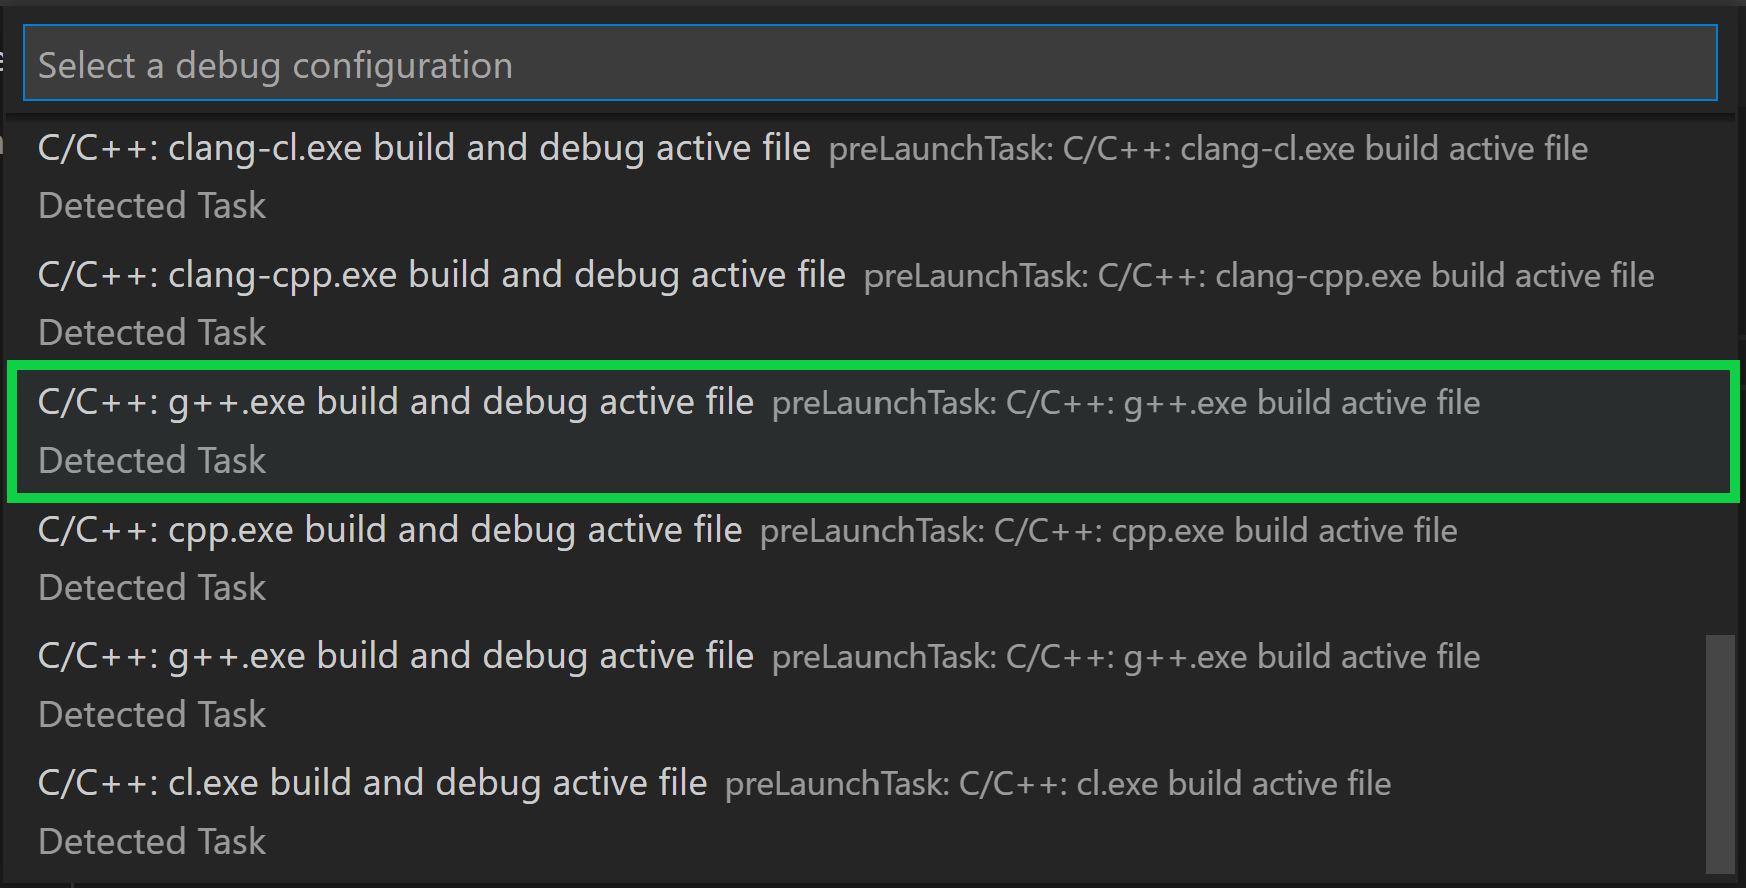
You can use it to compile your C++ project. Yes, even if your code is using GNU GCC. You can even use it to compile with makefile.
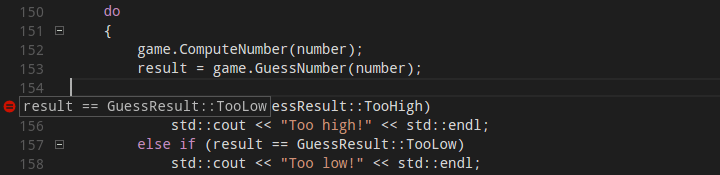
But what I'm really excited is visual debugging of C++ code.
The articles been out since May 2020 and it's only now that I've learned about this as my Open Source C++ project is starting to be more complicated and been harder and harder to debug with every new feature being added.
Who would have thought that one day you can use GNU GCC and GNU GDB with Visual Studio? -- well Visual Studio Code. Not me.
I'd like to think that it's all thanks to people who have pushed Free and Open Source Software, especially rms.
Happy hacking!
~creek23